
Income Statement Analysis: A Key to Identifying Good Stocks
📊 Why Income Statement Matters for Investors
Analyzing a company’s income statement is a vital step in identifying fundamentally strong stocks. It offers key insights into how much revenue the company generates, what it spends on operations, and how much profit it earns. For retail investors, understanding this document is crucial to make informed investment decisions.
An income statement, also called a profit & loss statement, shows:
Revenue (top line)
Expenses (costs of goods sold, operating expenses, etc.)
Net Profit (bottom line)
This information helps assess a company’s profitability, growth potential, and financial stability.
🧾 Key Components of an Income Statement:
- Revenue – Total income from sales.
- Cost of Goods Sold (COGS) – Direct costs attributable to production.
- Gross Profit – Revenue minus COGS.
- Operating Expenses – Costs like salaries, marketing, rent.
- Operating Profit (EBIT) – Earnings before interest and tax.
- Net Profit – Final earnings after tax and interest.
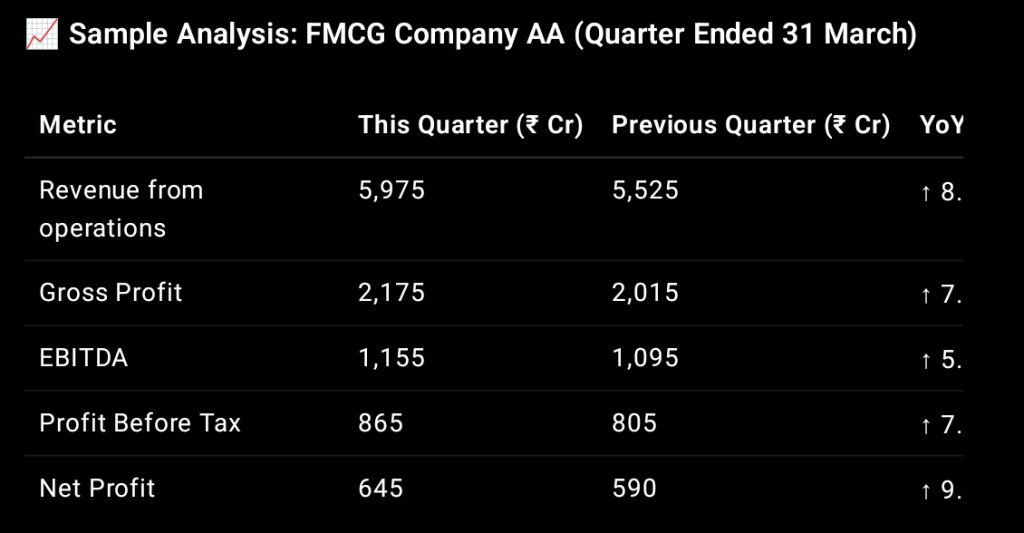
Revenue from operations 5,975 5,525 ↑ 8.1%
Gross Profit 2,175 2,015 ↑ 7.9%
EBITDA 1,155 1,095 ↑ 5.5%
Profit Before Tax 865 805 ↑ 7.4%
Net Profit 645 590 ↑ 9.3%
💡 Insights: The consistent growth in revenue, profit margins, and net income indicate strong financial health. This makes the company a potential candidate for long-term investment.
🧠 Metrifin’s Takeaway:
Understanding income statements enables investors to:
✅ Compare companies in the same sector
✅ Identify trends over multiple quarters
✅ Spot red flags like rising expenses or shrinking profit margins
🔍 Why Income Statement Analysis Matters to Investors
Compare with Peers: See how the company fares vs. competitors.
Track Over Time: Analyze trends over 4–8 quarters.
Detect Red Flags: Like rising costs or shrinking profits.
Gauge Financial Discipline: Through margins and expense control.
📝 Key Metrics to Watch
Metric What It Tells You
Gross Margin Production efficiency
Operating Margin Core business strength
Net Profit Margin Overall profitability
Revenue Growth Rate Market demand
EPS (Earnings per Share) Profit per share — critical for valuation
✅ Conclusion: How You Can Use This
The income statement is more than just numbers — it tells the story of how a business survives, grows, and thrives. When analyzed with consistency and logic, it becomes your most powerful tool in identifying quality companies for investment.
📍Next Step: Start reviewing income statements of your portfolio stocks and watch how much better your decisions become.
📌 Bottom Line: Learning how to read an income statement is like having a flashlight in a dark tunnel. It illuminates the way to solid investments. Keep following Metrifin.com for more expert analysis and stock insights!
🌐 For regular income statement breakdowns, expert stock analysis, and financial insights, visit Metrifin.com